By Daniel Story, Jeffry Erbig, and Greg O'Malley
Downloadable Materials:
| ArcGIS Data |
|
| Tutorial for Downloading and Preparing SlaveVoyages Data for Mapping |
|
| Tutorial for Mapping Data from SlaveVoyages |
|
| Teacher's Guide |
|
On-Site Teacher's Guide:
Overview & Background to Activity
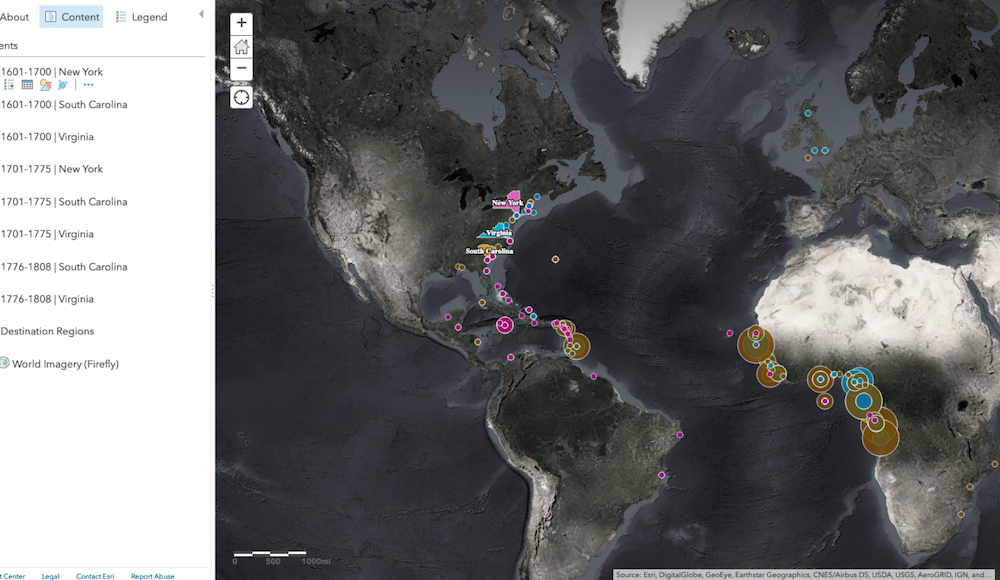
This lesson asks students to juxtapose two methodological approaches for understanding the slave trade to North America: one focused on broad patterns of human trafficking using big data and the other emphasizing individual captive experiences and responses using narrative sources. Students use the Transatlantic and Intra-American Slave Trade Databases at www.slavevoyages.org to digitally map the origins of captives taken to several North American colonies over time. (Their finished map should look like this: https://arcg.is/15b9Wz.) They will read Olaudah Equiano’s and/or James Albert Ukawsaw Gronniosaw’s autobiographical narratives for firsthand perspective from captives trafficked along these routes. Jessica Marie Johnson’s “Markup Bodies” will help students connect and compare the two methodological approaches to underscore their promise and limitations.
Through this exercise, students reflect upon how the data available on Slave Voyages was created, how it is organized, and the meanings it produces. They consider why this history of human trafficking produced a large paper trail and how historians have worked collaboratively to gather and organize this information. They pay particular attention to the limitations of a strictly data-driven approach to understanding embodied histories of human suffering, the alienating nature of inserting individual people into a spreadsheet, and recent efforts to address such limitations.
We recommend organizing the lesson as two in-class sessions, with readings and mapping work completed outside of class. In the first session, students discuss readings about the slave trade and sources/data for studying it. Then in a second session, after creating their digital maps, students discuss if and how visualizing data through mapping complements the reading of other types of source material. Discussion questions are provided below.
Optional Additions
The lesson as sketched here gives students ready-to-map data from SlaveVoyages on arrivals of people in three North American colonies. If instructors prefer to have students query the databases for their own data and/or to change the geographic focus of the exercise, they can use our Tutorial for Downloading and Preparing SlaveVoyages Data for Mapping to gather relevant data for students or to give students guidance in finding their own data. The mapping instructions in this lesson plan can then be used with that alternate data.
Likewise, if an instructor wants students to incorprorate analysis of their map into a paper or other writing assignment, the map created in this exercise can be easily imported into StoryMaps (https://storymaps.arcgis.com/), which is a user-friendly tool for pairing digital maps with text and other digital media.
Learning Objectives
Students will be able to
- Use and critically evaluate the Slave Voyages database
- Create a digital map using historical data
- Identify broad patterns in the African Diaspora to North America
- Consider captives' individual and collective experiences
- Assess the strengths and weaknesses of quantitative and qualitative historical methodologies
Mapping Tutorial and Readings (for Students)
- MAPPING GUIDE: ArcGIS Tutorial for Mapping Data from SlaveVoyages
- Note: Be sure to give students instructions regarding how you prefer them to submit their maps!For example, they could generate a link to the map that can be pasted into an email or an online course management system or take a screenshot of their map with the data displayed in various configurations.
- READING #1: Brief introductions to the Trans-Atlantic Slave Trade Database and Intra-American Slave Trade Database on the Slave Voyages website.
- In addition to assigning students these short readings that introduce the data they will use for their maps, we recommend having students explore the databases a bit, either in class or on their own, viewing the “summary statistics,” the introductory maps, and a few individual voyage records.
- READING #2: Jessica Marie Johnson, “Markup Bodies: Black [Life] Studies and Slavery [Death] Studies at the Digital Crossroads,” Social Text 36.4 (December 2018), 57-79 (https://doi.org/10.1215/01642472-7145658)
- Johnson raises important questions about the utility and limitations of digital and big data projects such as SlaveVoyages.org for assessing enslaved people’s experiences.
- READING #3 (one or both of the following):
- Olaudah Equiano, The Interesting Narrative of the Life of Olaudah Equiano, or Gustavus Vassa, the African. Written by Himself (London, 1789), vol. 1, pp. 45-94, 193-223.
- Equiano describes a journey as a child captive from Igboland [in modern southeast Nigeria] to the Bight of Biafra to Barbados and then to Virginia. He also describes working as an enslaved sailor on intra-American journeys delivering other captives from the Caribbean to South Carolina.
- James Albert Ukawsaw Gronniosaw, A Narrative of the Most Remarkable Particulars in the Life of James Albert Ukawsaw Gronniosaw, An AFRICAN PRINCE, As related by HIMSELF (Bath, England, 1772), pp. i-12
- The account by James Albert [née Ukawsaw Gronniosaw] is less detailed about the seaborne portion of the slave trade, but describes a journey from Borno [in modern northeast Nigeria] to the Gold Coast in some detail before briefly describing the crossing as a captive to Barbados and a subsequent intra-American passage to New York, all as a boy.
- Olaudah Equiano, The Interesting Narrative of the Life of Olaudah Equiano, or Gustavus Vassa, the African. Written by Himself (London, 1789), vol. 1, pp. 45-94, 193-223.
Additional Resources (for Instructors)
- For context on the Intra-American trafficking to North American colonies, see: Gregory E. O’Malley, “Beyond the Middle Passage: Slave Migration from the Caribbean to North America, 1619–1807” William and Mary Quarterly, 3rd Ser., 66.1 (Jan. 2009), 125-172 (https://www.jstor.org/stable/40212043)
- For more on Olaudah Equiano, see: Byrd, Alexander X. “Eboe, Country, Nation, and Gustavus Vassa’s Interesting Narrative.” William and Mary Quarterly 63, no. 1 (2006): 123-148 (https://www.jstor.org/stable/3491728); OR, Vincent Carretta, Equiano, the African: Biography of a Self-Made Man (Athens, GA, 2005)
- For more on James Albert / Ukawsaw Gronniosaw, see: Hanley, Ryan. “Calvinism, Proslavery and James Albert Ukawsaw Gronniosaw.” Slavery & Abolition. 36.2 (2015): 360–381 (https://doi.org/10.1080%2F0144039X.2014.920973); OR, Henry Louis Gates, Jr, The Signifying Monkey (Oxford University Press, 1988), 133–40.
Discussion Questions
Slave Voyages Database
- What are the Trans-Atlantic and Intra-American Slave Trade Databases? What does each include? What is the difference between the two?
- How were they created?
- What kinds of sources did historians use to create them?
- What are all the columns that appear in the database? And/or what are all the fields of information in an individual voyage record?
- Do the voyage records identify or allow historians to track individual enslaved people?
- What kinds of historical questions can a database of voyages that carried enslaved people help us answer or investigate?
- What are the limitations of a data-driven approach?
Johnson's "Markup Bodies"
- What does Johnson mean when she calls for "truly embodied" histories of the slave trade or calls on "researchers to witness and remark on the marked and unmarked bodies, the ones that defy computation, and finds ways to hold the null values up to the light?"
- How did the Slave Voyages database attempt to overcome the limitations of cliometricians of the 1970's (61-65)?
- What critiques were made of the original version/presentation of the database?
- How does Johnson assess their subsequent response?
- How does Johnson define "black digital studies" and how do the examples that she gave demonstrate this initiative (58-59, 65-70)?
- How does Johnson's work shape the way you read and use the data available via slavevoyages.org?
- What, according to Johnson, constitutes a "just attention to the dead" by digital humanists (58)?
- What strategies might you use in order to meet Johnson's call to pay "just attendtion to the dead"?
- What other types of sources or research methodologies might one need to heed Johson's call for a more humanizing portrayal?
Equiano and/or Gronniosaw
- How do Equiano and/or Gronniosaw describe becoming enslaved in Africa?
- How did they reach the Atlantic for sale to European slave traders?
- How do they describe their seaborne journeys to Virginia/New York?
- How do they describe their first encounters with Europeans?
- How do they describe their encounters with Africans of different backgrouns? By the time they reached ships for the Atlantic crossing, were they traveling with kin, strangers who shared their language and background, or completely foreign people?
- How might the fact that they describe experiencing the slave trade as children have shaped their narratives?
- What kinds of historical questions can narratives by survivors of the slave trade help us answer or investigate?
- What are the limitations of thesea ccounts? How representative are they likely to be of the experiences of other enslaved people?
Mapping Tutorial
- What do you notice about change over time in your map (in terms of the numbers of captives arriving in different colonies, where hey were coming from, etc.)?
- How do NY, VA, and SC compare regarding the scale of the slave trade to each, when it started and ended, and how much each colony relied on direct African vs. intra-American trafficking?
- How do your maps compare with what you expected to find (e.g. where most people were taken captive or trafficked to)? How would you explain any differences between your expectations and what the maps show?
- What do you find satisfying and/or dissatisfying about the map? (question about mapping for data presentation)
- What would you do to improve it?
- What kinds of historical questions can the map you created in this exercise help us answer or investigate?
- What are the shortcomings and limitations of this mapping approach?
- Can you think of ways to enhance or present your map for a more "truly embodied" presentation of information about the history of the slave trade (i.e. one that better portrays the humanity of the people behind the numbers)?
On the value of blending quantitative and individual-centered approachers
- What can we gain by considering the Slave Voyages databases together with individual narratives?
- How is your understanding of the quantitative data and/or your map enhanced by having read the narrative of an individual who survived the slave trade?
- How is your interpretation of an individual account of the slave trade enhanced by having examined broader patterns with quantitative data and maps?
- What other strategies might you employ to make better use of each of these research approaches?